


Background
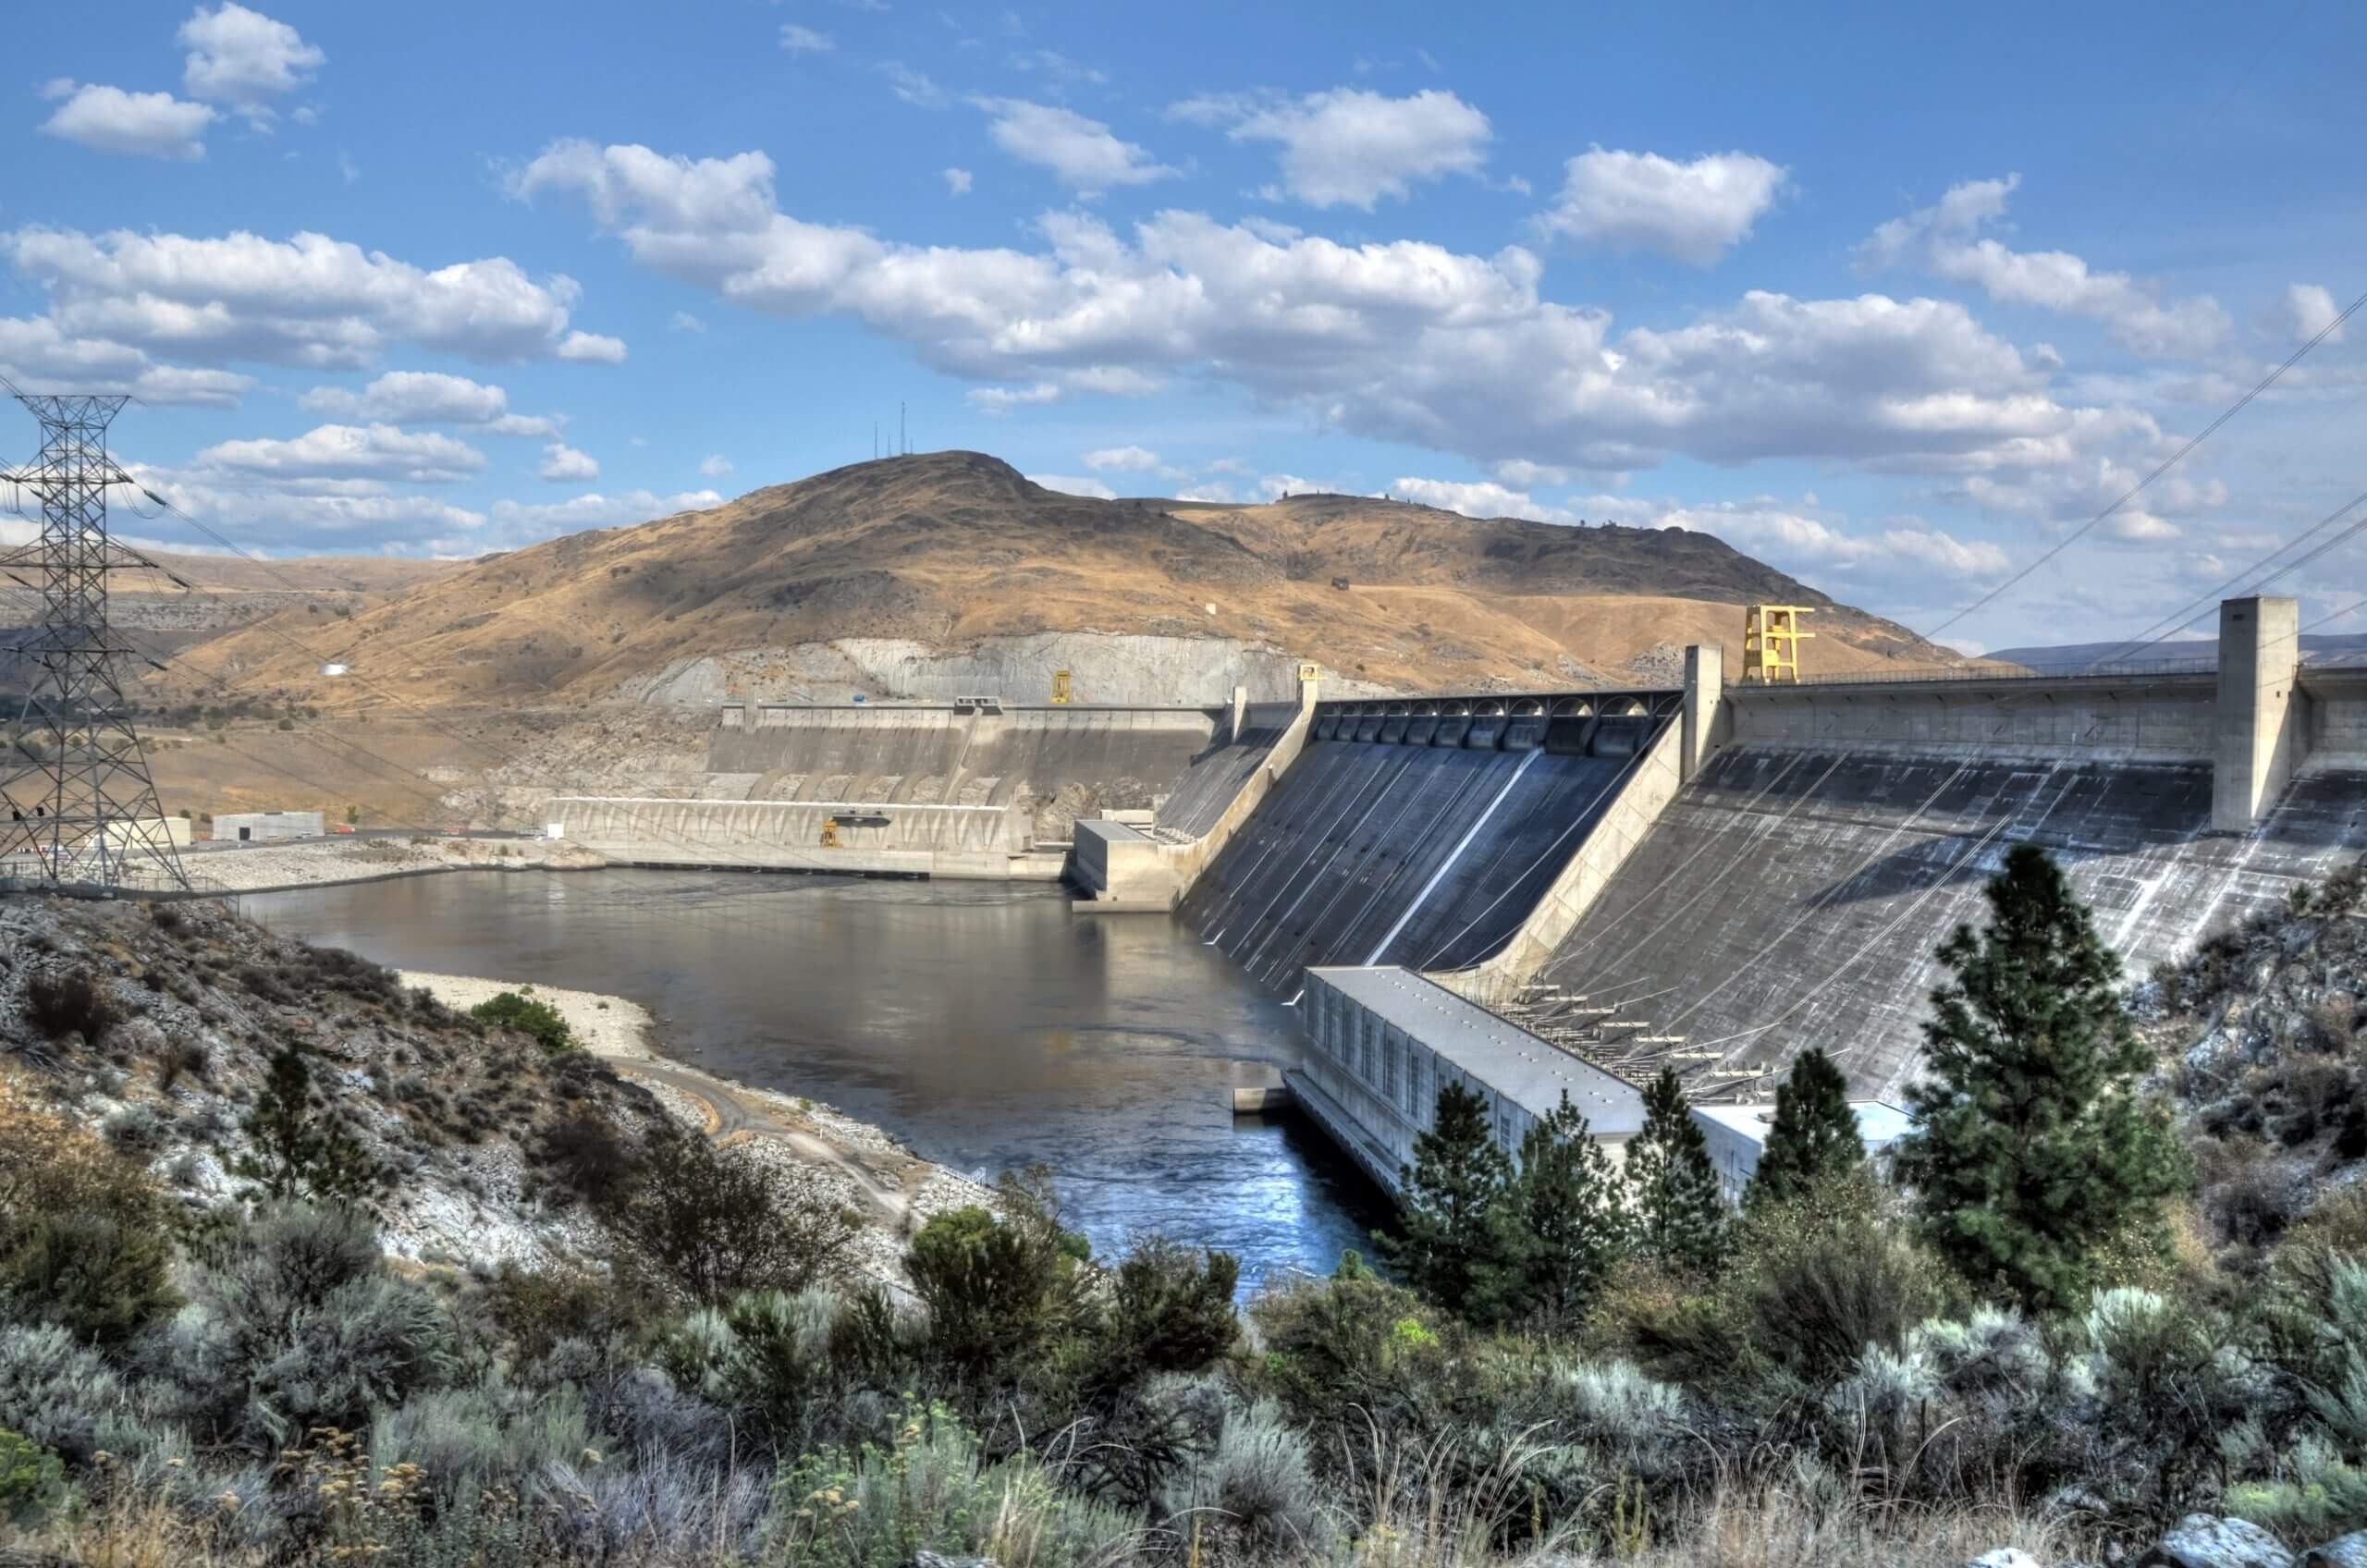
The water utility of Northern Ireland supplies 560 million liters of clean water a day for almost 1.8 million people as well as treating 320 million liters of wastewater a day.
Challenge
Old, malfunctioning infrastructure
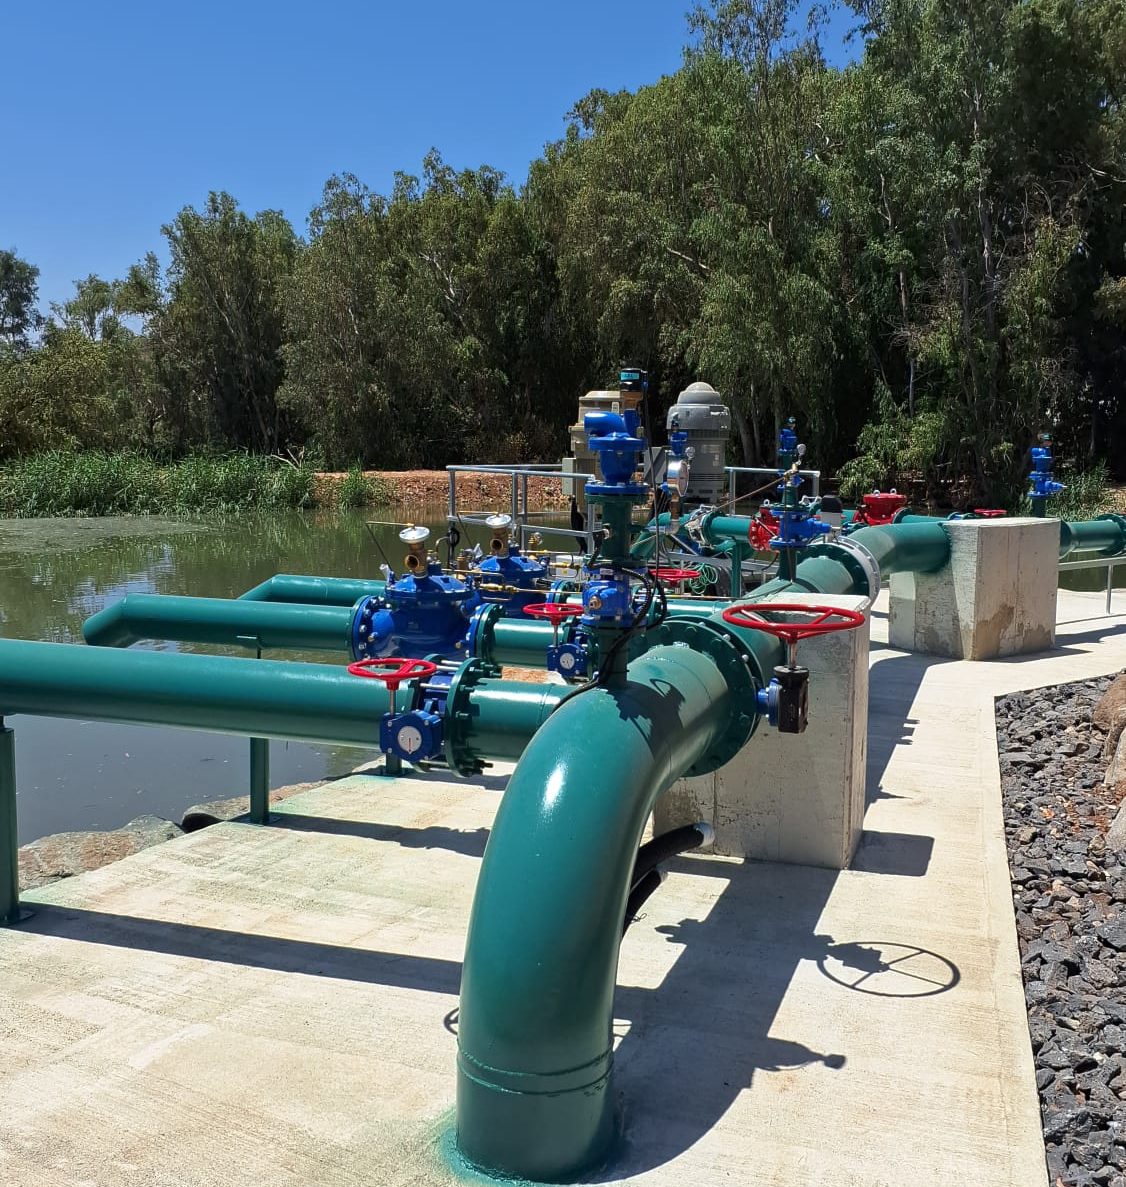
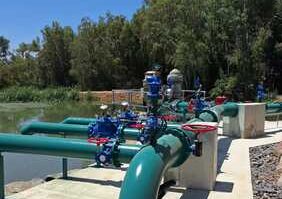
The utility company embarked on a project to reintroduce appropriate pressure management to a water supply zone (WSA) of 9772 properties, predominantly domestic in nature. The infrastructure in the zone was mostly characterized by old 5” cast-iron mains, installed in around 1920-1930. The poor internal condition of the pipes caused excessive low pressures at times of peak demand.
The existing electromagnetic flow meter and old piston-actuated PRV were surveyed for possible service and re-use. The flow meter was found to be non-operable, while the internal trim of the old 10” PRV was seized. Both were deemed to be beyond economic repair.
Solution
Reducing and modulating pressure
Using a background leakage figure of 45 m3/hr, the flow prediction software utilized to calculate expected flow regimes into the WSA put peak flow at 287 m3/hr (79.8l/s) and minimum flow at 63.4 m3/hr (17.6 l/s).
Pressure logging revealed a possible 10-12 mwc reduction in pressure, with some form of modulation at night. Inlet pressure is fixed at about 62 mwc, reduced to a modulated downstream pressure of less than 50 mwc (see graph below).
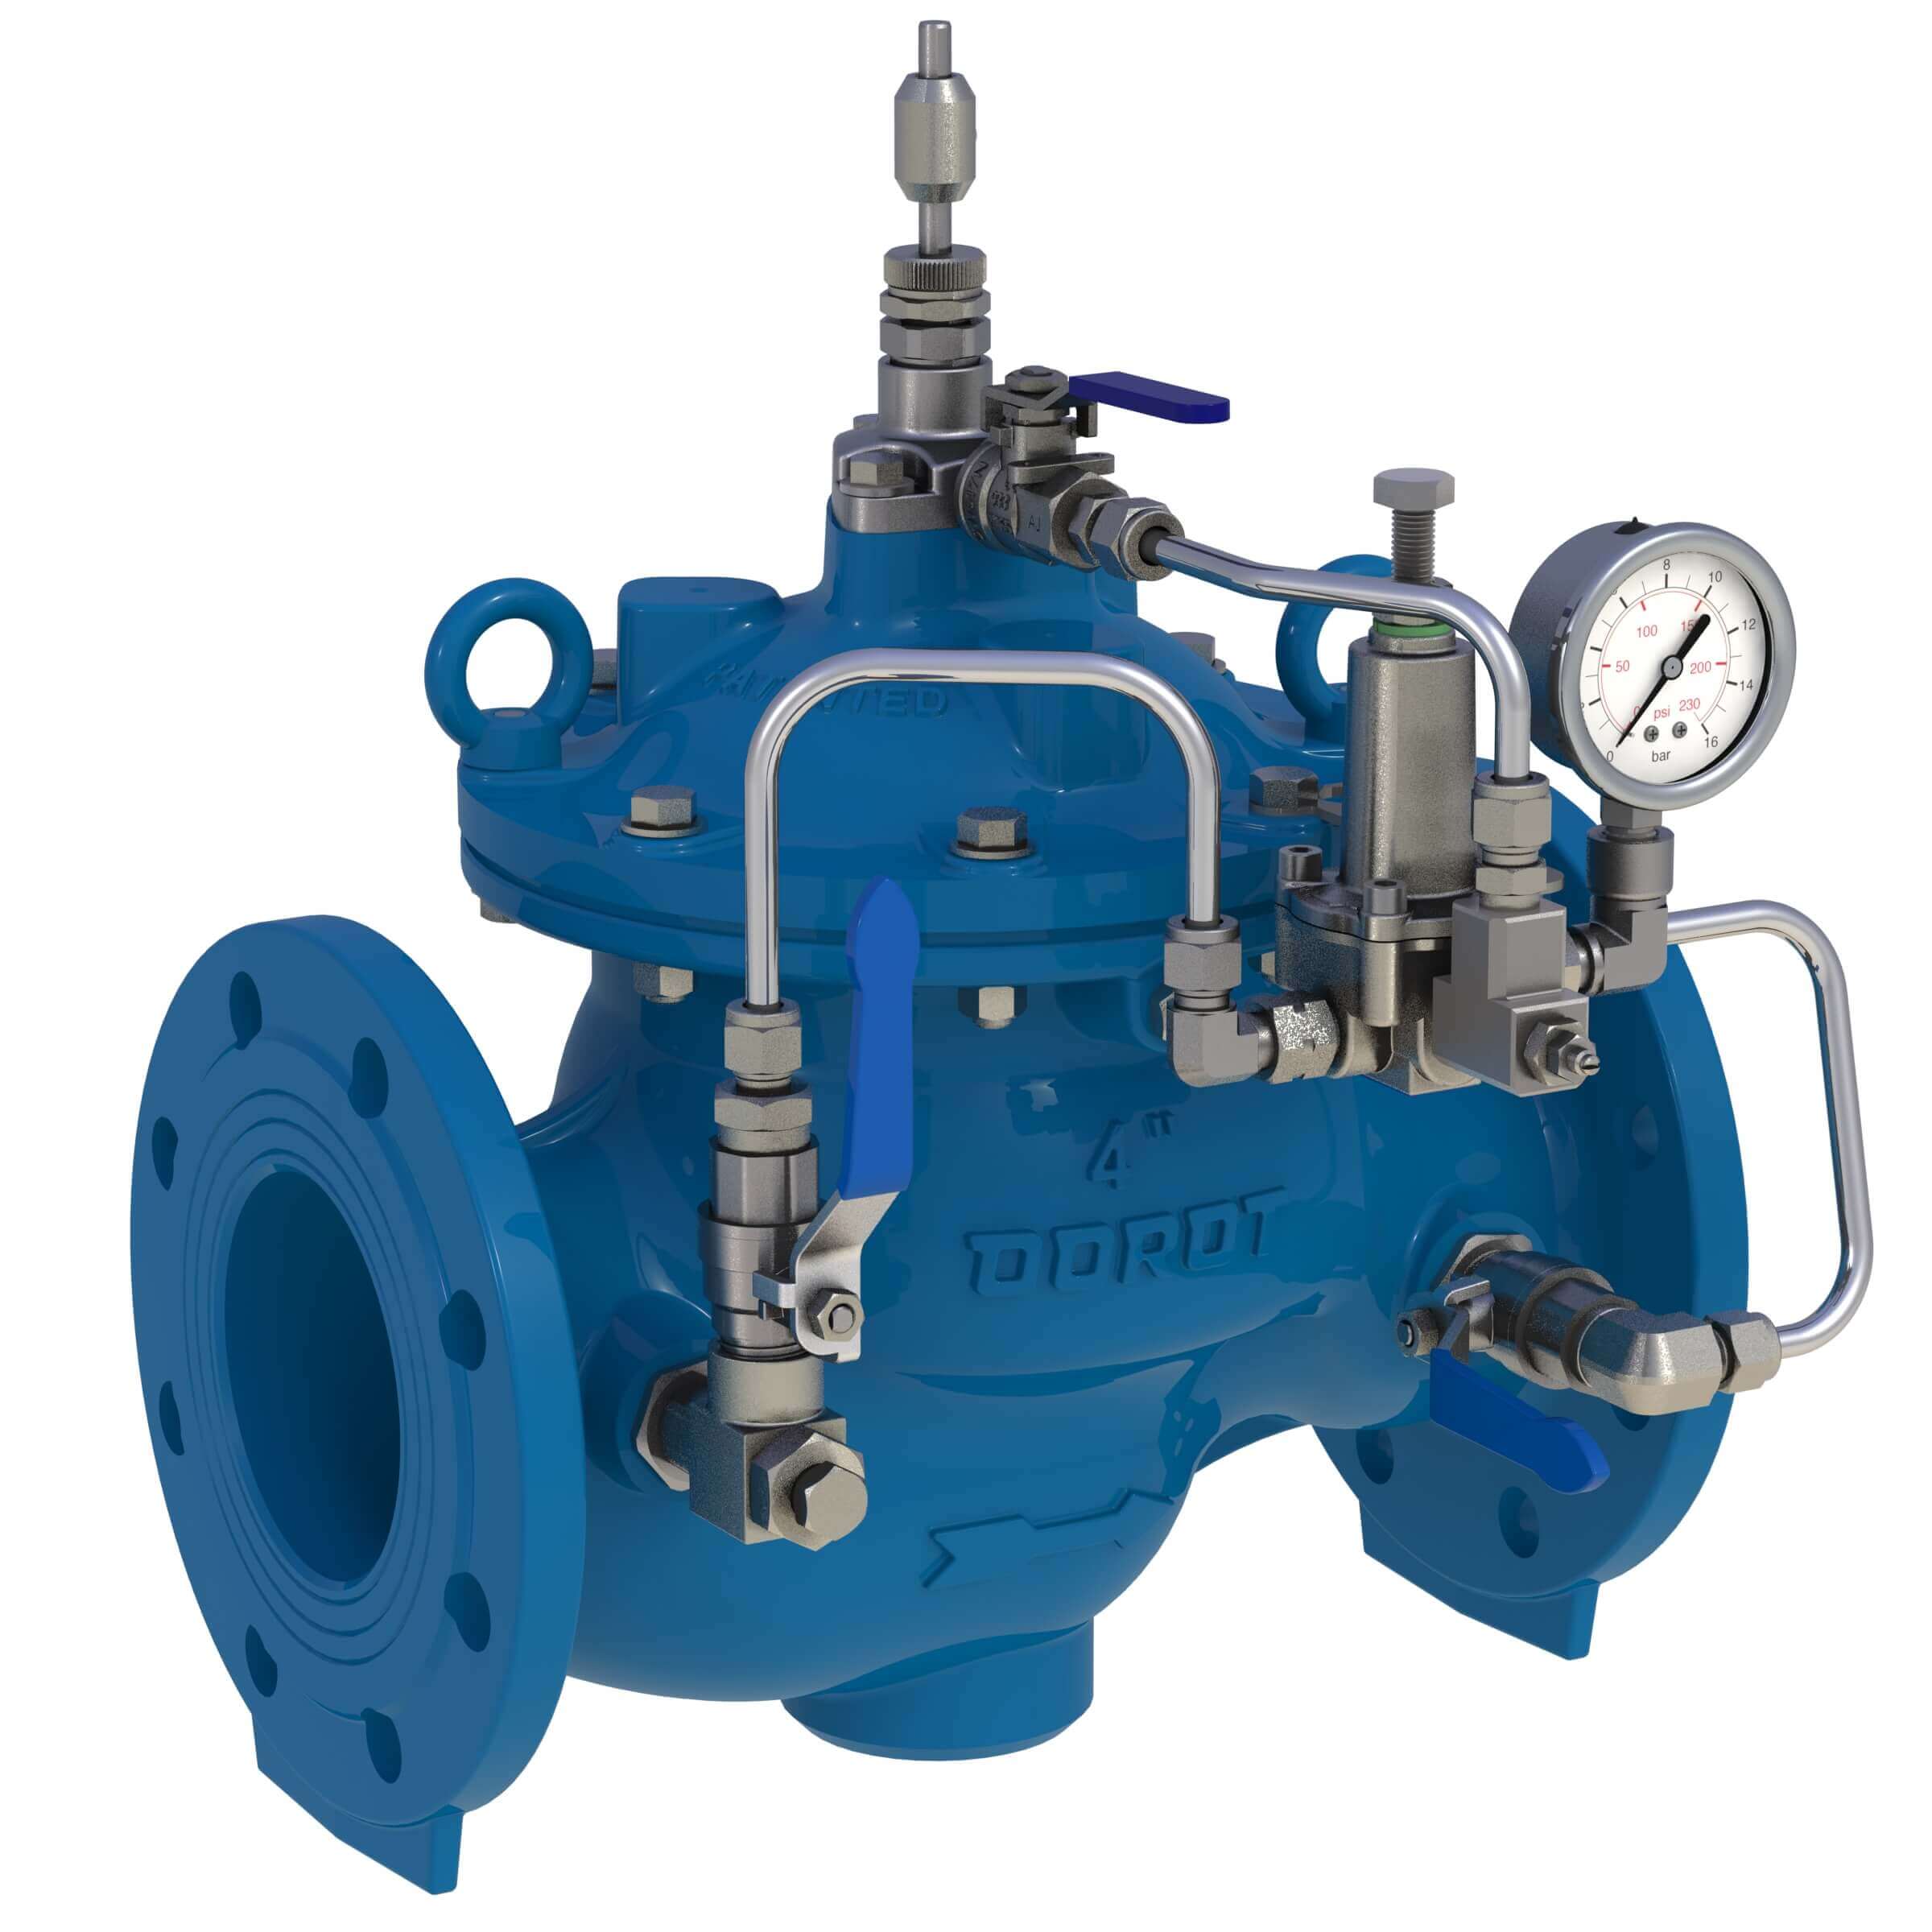
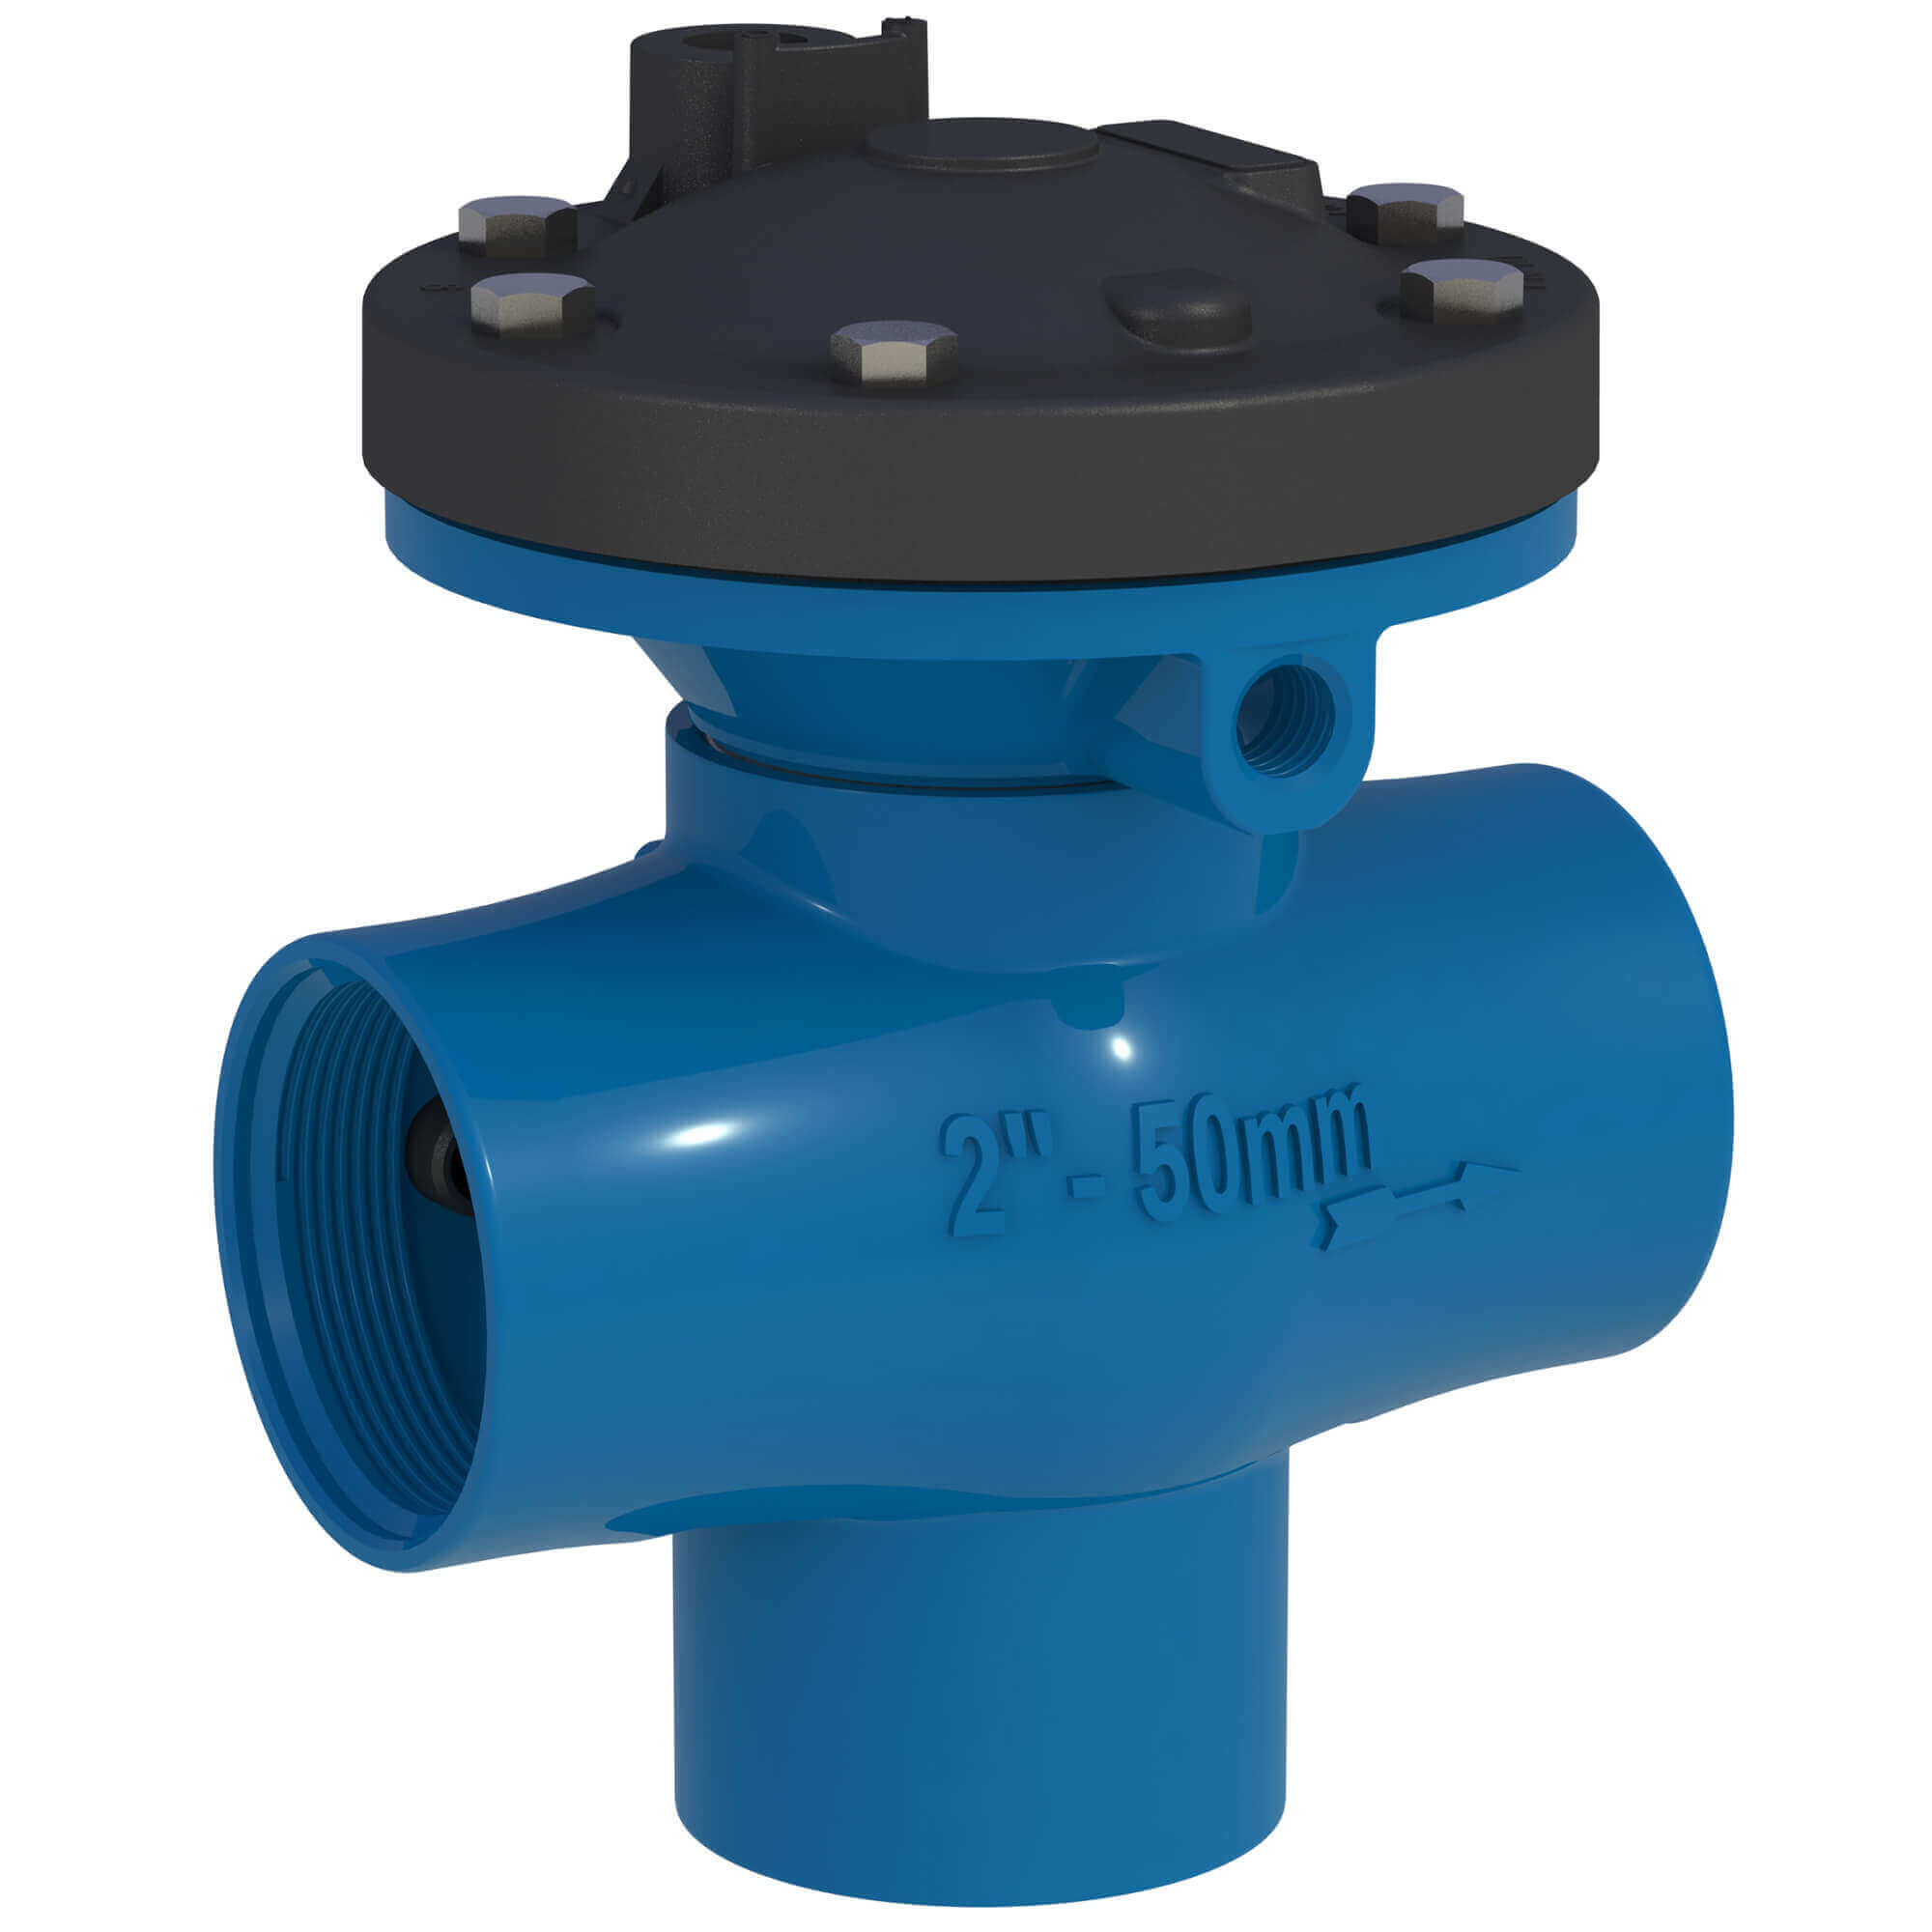
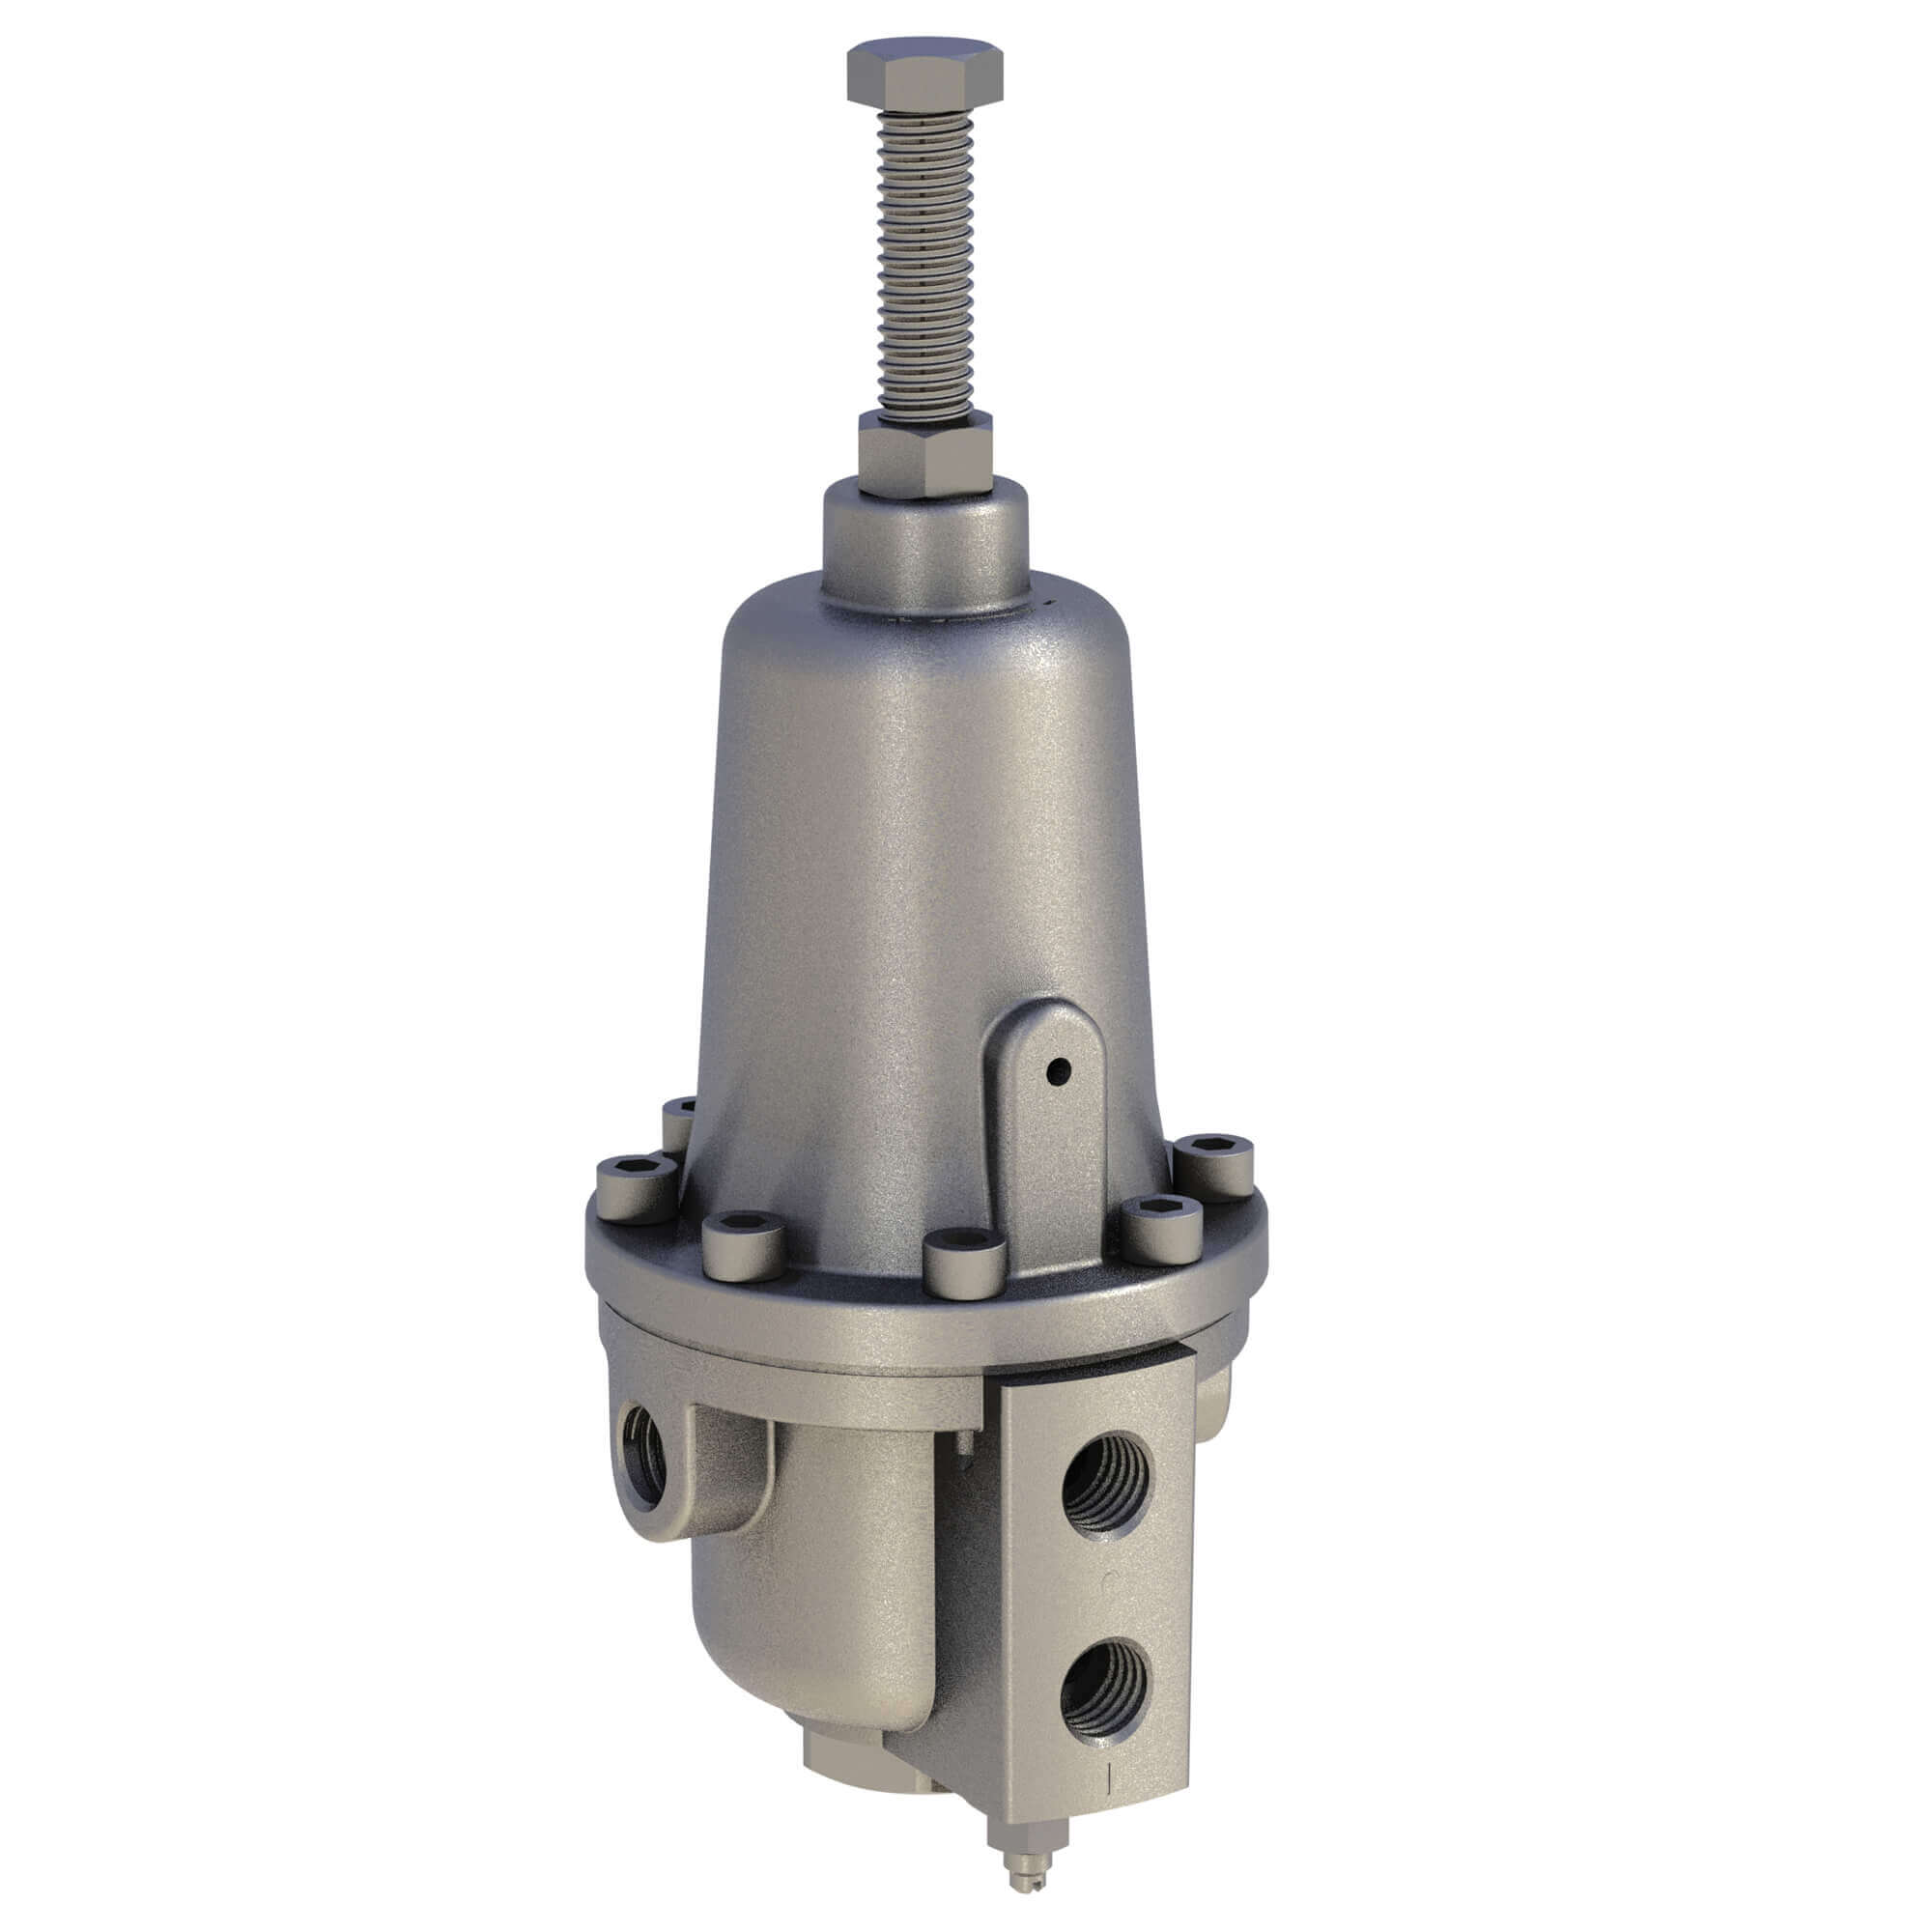
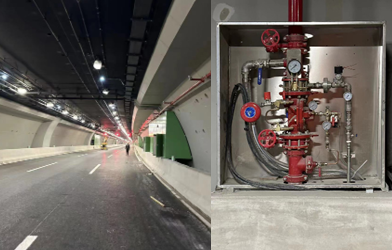
The old, malfunctioning PRV was replaced with a new, smaller, 200 mm diaphragm actuated PRV, fitted with a DOROT S300 PRM(HyMod) hydraulic pressure modulator.
Results
Over a million liters of water saved per day
Strategically located pressure loggers demonstrated the impact that pressure management had on the water supply.
East 2 – Pre and post PRV Commissioning Pressure

Flow regime data from the sub-zone of Ravenhill Road 2 – where there are some 1236 properties – before and after commissioning of the DOROT S300 PRM(HyMod) showed a volumetric reduction of 0.13mld (million liters per day). By extrapolating this over the whole area of 9770 properties, an overall volumetric saving of approximately 1.08mld can be calculated.
East 2 – Pre and post PRV Commissioning Flow-Rates

The flow-rate graph above indicates a reduction in nightline – shown as a red dotted line – of approximately 1.5 lit/sec.

Summary of volumetric flow data in m3/day